Traffic Lighting Examples
Learn how to design traffic lighting rules and see how they are evaluated.
Highlight specific metric values
You want to quickly summarize and highlight the performance of each organization based on their turnover rate.
Using the Metric value rule type, you apply the following traffic lighting rules to a Breakdown of Turnover Rate by Organization Hierarchy for 2017:
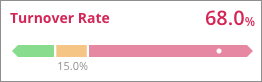
- Metric value is greater than 25.0%, traffic light as Bad.
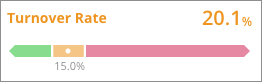
- Metric value is between 15.0% and 25.0%, traffic light as Concerning.
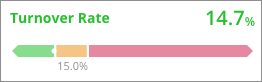
- Metric value is less than 15.0%, traffic light as Good.
Chart with traffic lighting rules applied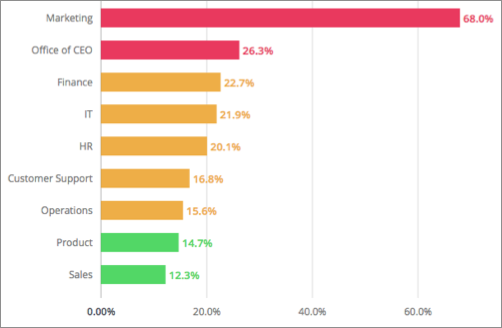
Calculation details
| Group | Turnover Rate: 2017 |
|---|---|
| Marketing | 68.0% |
| HR | 20.1% |
| Product | 14.7% |
Evaluation details
| Group | Rule 1 | Rule 2 | Rule 3 |
|---|---|---|---|
| Marketing |
Meets rule. Metric value (68.0%) is greater than threshold (25.0%). |
Rule is not evaluated as preceding rule was met. | Rule is not evaluated as preceding rule was met. |
| HR |
Does not meet rule. Metric value (20.1%) is less than threshold (25.0%). |
Meets rule. Metric value (20.1%) lies within thresholds (15.0% and 25.0%). |
Rule is not evaluated as preceding rule was met. |
| Product |
Does not meet rule. Metric value (14.7%) is less than threshold (25.0%). |
Does not meet rule. Metric value (14.7%) does not lie within thresholds (15.0% and 25.0%). |
Meets rule. Metric value (14.7%) is less than threshold (15.0%). |
Results
| Group | Result |
|---|---|
| Marketing |
43pp above bad threshold (68.0−25.0). |
| HR |
4.9pp below bad threshold (25.0-20.1). |
| Product |
0.3pp below concerning threshold (15.0-14.7). |
Monitor changes in a metric value
You want to be alerted when the resignation rate has increased significantly for a given organization when compared to the previous period.
Using the Change in metric value rule type, you apply the following traffic lighting rules to a Breakdown of Resignation Rate by Organization Hierarchy for March 2018:
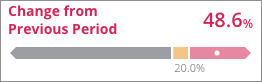
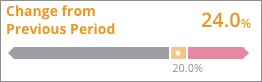
- Change from Previous Period is greater than 30.0%, traffic light as Bad.
- Change from Previous Period is greater than 20.0%, traffic light as Concerning.
Chart with traffic lighting rules applied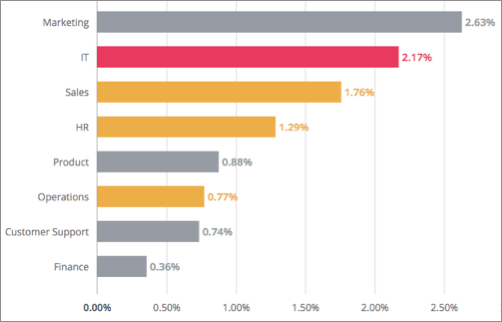
Calculation details
| Group |
Resignation Rate: March 2018 |
Resignation Rate: February 2018 |
Change from Previous Period | Percentage Change from Previous Period |
|---|---|---|---|---|
| IT | 2.17% | 1.46% | 0.71% (2.17−1.46) | 48.6% (0.71)/1.46 |
| HR | 1.29% | 1.04% | 0.25% (1.29−1.04) | 24.0% (0.25)/1.04 |
Evaluation details
| Group | Rule 1 | Rule 2 |
|---|---|---|
| IT |
Meets rule. Percentage change from previous period (48.6%) is greater than threshold (30.0%) |
Rule is not evaluated as preceding rule was met. |
| HR |
Does not meet rule. Percentage change from previous period (24.0%) is less than threshold (30.0%). |
Meets rule. Percentage change from previous period (24.0%) is greater than threshold (20.0%). |
Results
| Group | Result |
|---|---|
| IT |
18.6pp above bad threshold (48.6−30.0). |
| HR |
4.0pp above concerning threshold (24.0−20.0). |
Monitor differences between two metrics
Comparing actual headcount with planned headcount
You want to reduce headcount by the end of the year. To ensure that you reach this goal and have enough time to make adjustments to your workforce plan, you want to be alerted when the difference between your actual headcount and your planned headcount reaches a significant threshold.
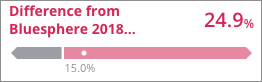
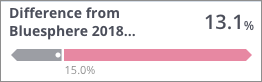
Using the Difference from another metric rule type, you apply the following traffic lighting rule to a Breakdown of Headcount by Organization Hierarchy for March 2018:
- Difference from plan headcount is greater than 15.0%, traffic light as Bad.
Chart with traffic lighting rules applied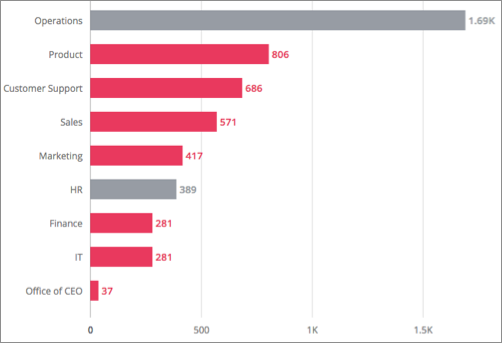
Calculation details
| Group |
Actual Headcount: March 2018 |
Plan Headcount: March 2018 |
Difference | Percentage Change |
|---|---|---|---|---|
| Marketing | 417 | 334 | +83 (417−334) | 24.9% (83/334) |
| HR | 389 | 344 | +45 (289−344) | 13.1% (45/344) |
Evaluation details
| Group | Rule |
|---|---|
| Marketing |
Meets rule. Percentage change from plan headcount (24.9%) is greater than threshold (15.0%). |
| HR |
Does not meet rule. Percentage change from plan headcount (13.1%) is less than threshold (15.0%). |
Results
| Group | Result |
|---|---|
| Marketing |
9.9pp above bad threshold (24.9−15.0). |
| HR |
1.9pp below bad threshold (15.0−13.1). |
Comparing to an overall benchmark value
One way to assess your organization's diversity and inclusion practices is to compare against benchmark values. To ensure the diversity mix of your workforce is aligned with industry standards, you want to be alerted when there is a large difference between your organization's minority ratio and the overall benchmark value.
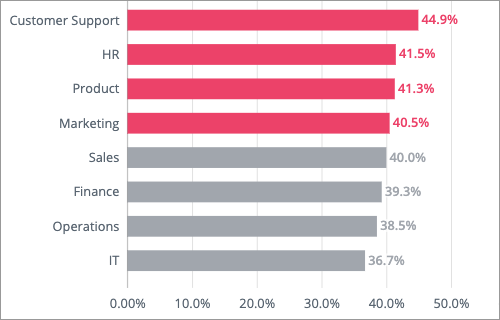
Using the Difference from metric overall rule type, you apply the following traffic lighting rule to a Breakdown of Minority Ratio in US by Organization Hierarchy filtered to permanent employees for March 2018:
- Difference from Minority Ratio - My EEOC Benchmark is greater than 20.0%, traffic light as Bad.
Note:
- With this rule type, the metric value for each visual item is compared to the overall value of another metric. As a result, you can apply different filters to the comparison metric to refine the analysis population. In this example, you can apply a filter to the Minority Ratio - My EEOC Benchmark so the traffic light is compared to the overall industry benchmark value for women instead of the overall industry benchmark value.
- The analysis context for your visual (filters, assumptions, and security permissions) will also be applied to the comparison metric. If any part of the analysis context cannot be applied to the comparison metric, you'll see the Some filters don't apply note in the Insights tab of the Info panel. Expand the note and click Inspect context to find out what parts of the analysis context has been applied to the comparison metric.
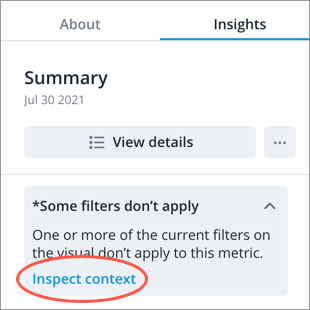
In this example, the filter for permanent employees cannot be applied to the comparison metric used in the traffic light. This is because the data for the Minority Ratio - My EEOC Benchmark does not break down between permanent and contingent employees.
Chart with traffic lighting rules applied
| Group |
Minority Ratio in US: March 2018 |
Minority Ratio - My EEOC Benchmark: March 2018 |
Difference | Percentage Change |
|---|---|---|---|---|
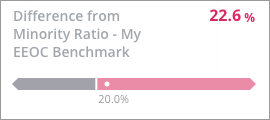
| Product | 41.3% | 33.7% | +7.6% (41.3-33.7) | 22.6% (7.6/33.7) |
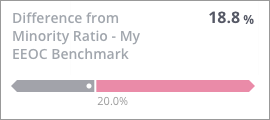
| Sales | 40.0% | 33.7% | +6.3% (40.0-33.7) | 18.8% (6.3/33.7) |
Evaluation details
| Group | Rule |
|---|---|
| Product |
Meets rule. Percentage change from Minority Ratio - My EEOC Benchmark (22.6%) is greater than threshold (20.0%). |
| Sales |
Does not meet rule. Percentage change from Minority Ratio - My EEOC Benchmark (18.8%) is less than threshold (20.0%). |
Results
| Group | Result |
|---|---|
| Product |
2.6pp above bad threshold (22.6-20.0). |
| Sales |
1.2pp below bad threshold (20.0-18.8). |
Monitor differences between groups
To ensure your organization has a diverse and balanced work environment, you want to be alerted when there is a large difference between the resignation rate for women and men.
Using the Difference from group rule type, you apply the following traffic lighting rule to a Breakdown of Resignation Rate by Organization Hierarchy filtered to women for March 2018.
- Difference from men is greater than 10.0%, traffic light as Bad.
Chart with traffic lighting rules applied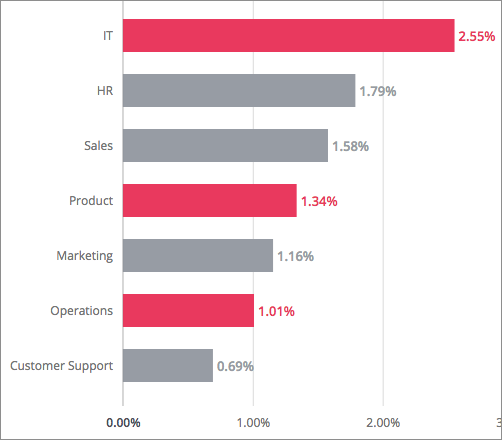
Calculation details
| Group |
Resignation Rate for Women: March 2018 |
Resignation Rate for Men: March 2018 |
Difference | Percentage Change |
|---|---|---|---|---|
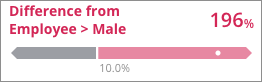
| IT | 2.55% | 0.86% | +1.69 (2.55−0.86) | 196% (1.69/0.86) |
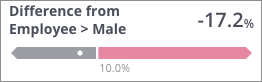
| Sales | 1.58% | 1.91% | -0.33 (1.58−1.91) | -17.2% (-0.33/1.91) |
Evaluation details
| Group |
Rule |
|---|---|
| IT |
Meets rule. Percentage change from resignation rate for men (196%) is greater than threshold (10.0%). |
| Sales |
Does not meet rule. Percentage change from resignation rate for men (-17.2%) is less than threshold (10.0%). |
Results
| Group |
Result |
|---|---|
| IT |
186pp above bad threshold (196−10.0). |
| Sales |
27.2pp below bad threshold (-17.2−10.0). |